


Why unit economics matter when searching for multi-baggers
Going back to first principles

A small note: Atmos Invest is no more. I’ve changed the domain to 100baggerhunting.com. It’s simpler. It’s more focused. If you bookmark this website somewhere, you might want to redo that bookmark. Future emails will be sent from a @100baggerhunting.com email address. I hope you like it!
You already know it’s best to think about stocks as businesses and not just pieces of paper.
This means thinking in enterprise value or operational profits as opposed to price/earnings multiples.
When I talk to successful entrepreneurs who also became great investors, they always mention 1 thing:
“Understand the Unit Economics of the business”
Say what?
Let’s find out why it matters and what we can do ⬇️
Why unit economics matter?
When you’re hunting for 100-baggers, you best choose your hunting grounds carefully.
You want a business in an industry that can easily scale, with low incremental investments.
The best examples are:
SAAS stands for software as a service. You build the product once, and your market can be huge (there are no physical constraints). With scale, incremental investments will decrease.
Others require more investment, but were some of the favorites of Peter Lynch:
Restaurants: You built a successful restaurant in one location. You expand to several others. It seems to work irrespective of geography. You’re good to scale up!
Retail stores: Same thing
There might be more investment needed in these 2 examples unless it’s a franchising operation. The bulk of the investment would come from the franchisee.
If you can figure out what the unit economics are for 1 unit and if you can determine if unit economics are improving, you might have a great business in your crosshairs.
Lastly, it’s a way to simplify certain business as the whole of the business = the sum of the units + some overhead.
Ok, so what are unit economics?
What are they?
The idea is to choose “the unit”. The denominator. Like cutting up the business into its smallest parts that still makes sense.1
One store for a retailer (Walmart)
One restaurant for a fast-casual chain (Chipotle)
One ship for an ocean shipping company (Maersk)
One subscription for a software-as-a-service business (Salesforce)
One individual online purchase for an e-commerce company (Amazon)
It’s a choice you make. Often the company will do some of the work for you in their annual report.
If the economics for 1 unit are attractive, then the sum of the parts should be too (unless for some reason the company has massive overhead costs). If a company is growing, and the unit economics are improving, there might be an opportunity when the market isn’t looking. (unit economics takes some additional work beyond just looking at the overall top-line revenue or bottom-line earnings).
A physical store
The unit is the store. You can now calculate how revenue or costs have evolved per store.
Call it a coincidence, but while I was writing this article, Finchat.io just released a new functionality to create custom metrics.
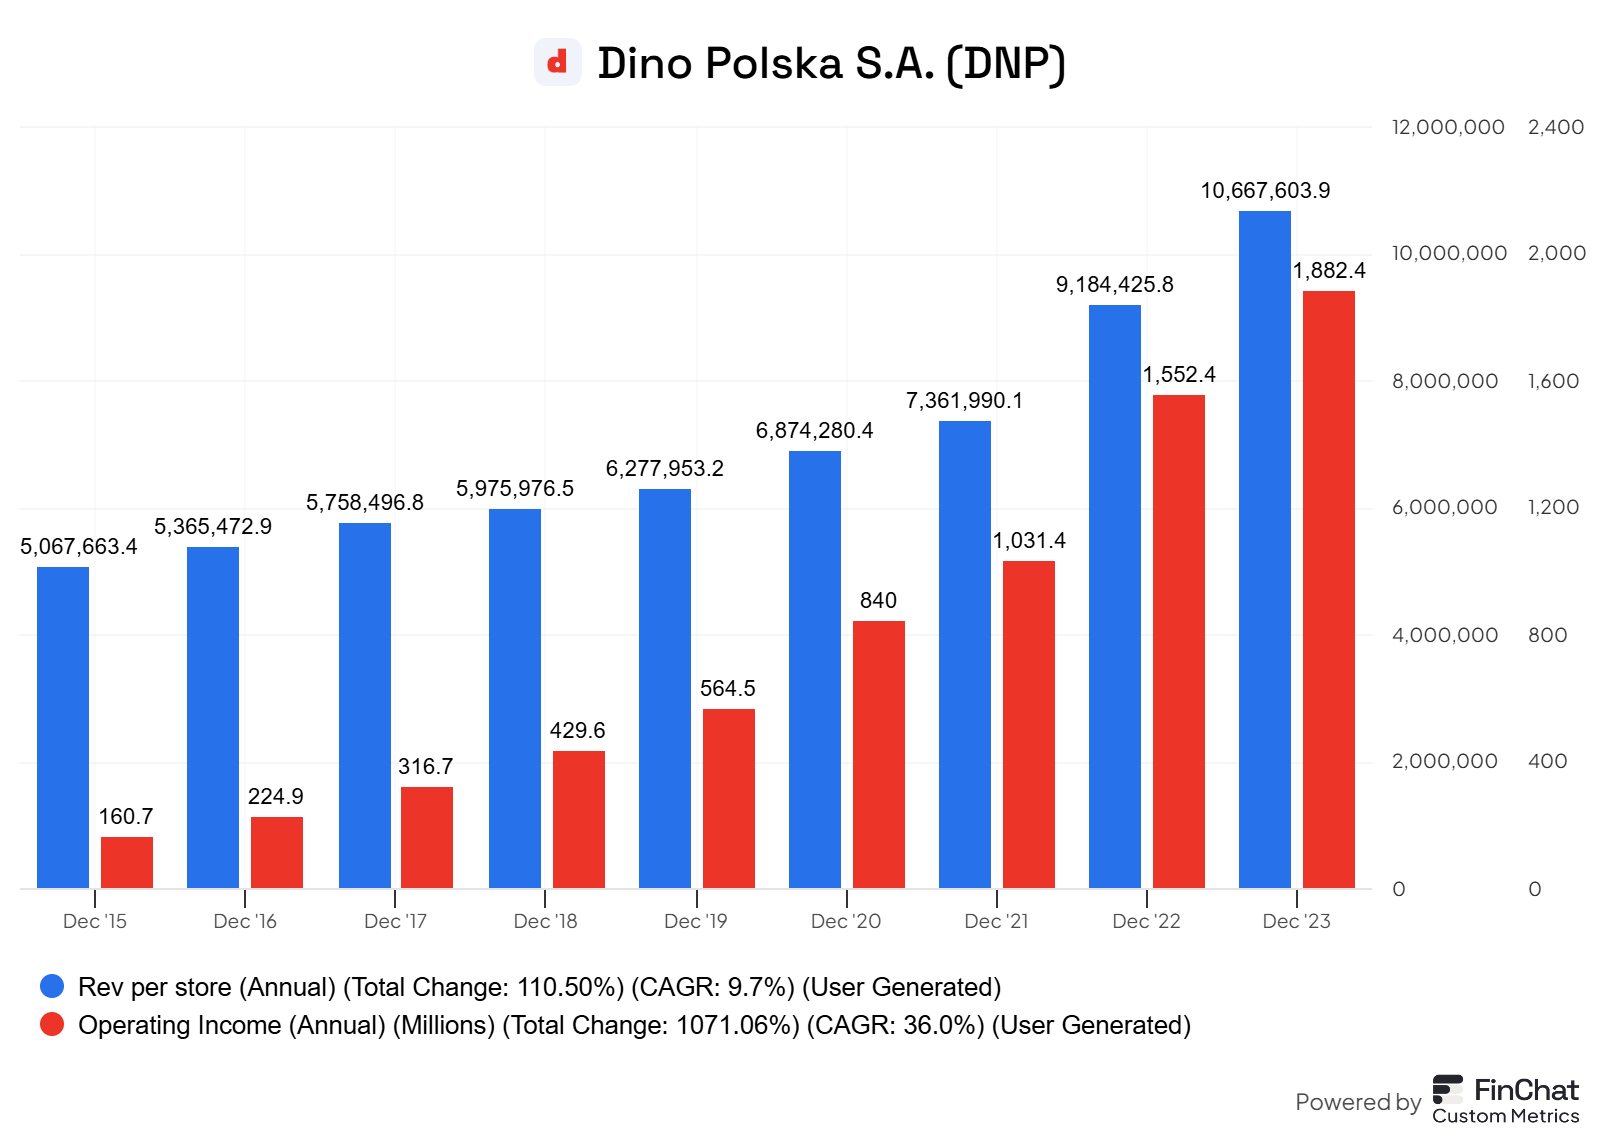
Let’s take a look at revenue and operating income per store for Dino Polska (DNP.WA)
This is the most powerful update for Finchat.io yet. They already had specific segment KPIs they extracted from the annual reports. Now you can make a sort of combination as you see fit.
Here’s a short video where I show you how easy it is. Bruh, yet another video? (yep, I’m learning the lingo from my 9-year old 😉)
If you believe Finchat is something for you, you can use the below discount link
Revenue per store is increasing, with a massive increase in 2022 and 2023. But operating income per store is increasing faster.
Now, this is a quick setup I did—less than a minute. We need to be careful with the interpretation, as Dino launched many new stores in 2022 and 2023. So, if you want to get an idea of what the unit economics look like, you need to create cohorts.
Cohorts
When a store opens, time is needed to reach its full capacity. You can define the stores in cohorts:
New Store (0-1 year)
Growing store (2-3 years)
Mature store (3+ years)
This takes some work, but you can estimate what the typical unit economics would be for each cohort in a bottom-up approach. Since you know how many new stores are added each year, you can construct a more granular approach to the overall revenue model.
Here’s a great example based on the Deep Dive of Dino Polska by Jon Cukierwar where he has made estimates on the revenue generated by a new store versus a mature store.
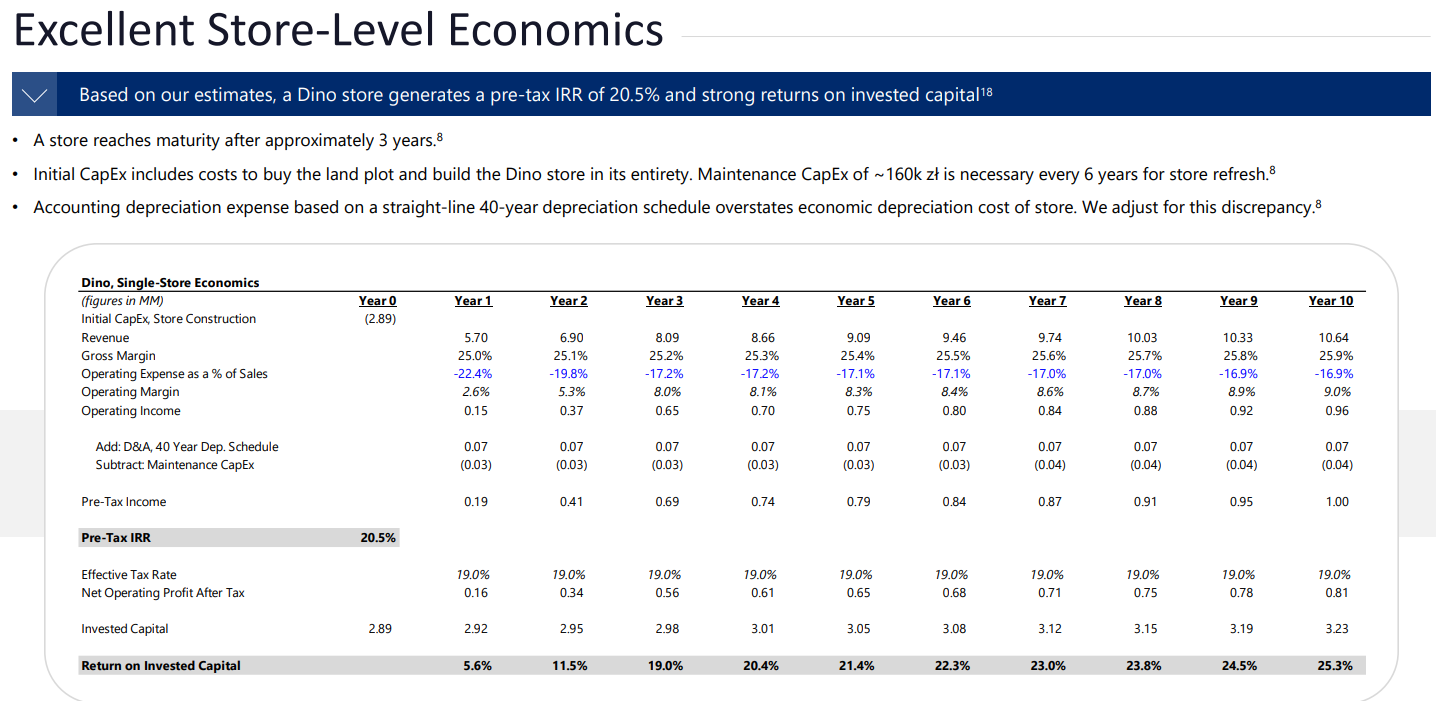
You can find his full analysis of Dino here.
There might be a spring coil or bullwhip effect inside the company that the market has not recognized.
An example:
The company has 2000 stores and has opened 300 new stores in the last fiscal year. It takes 3 years for those stores to come to maturity. The full revenue effect from those new stores will only be visible 3 years later. Has the market taken this into account when the stock is priced?
Let’s give a more specific example from an interview with John Zolidis from Quovadiscapital.
Fivebelow is a company where when looking at total revenue, it was increasing by 10%. The earnings were increasing even faster. But when you calculate the sales / average store, this only increases by 2% each year. Meaning, the newer stores were generating the bulk of the growth. Now you can revise your expectations based on how many new stores they plan to build, and compare the result to what is priced in the market.
Doing these kinds of bottom-up approaches, calculating unit economics, John tries to see if there is a bet against the current expectations in the market.
A simple example
Sales year 1: 100 Million USD

Sales year 2: 120 Million USD

You know the total revenue growth from year 1 to 2: 20%

A retailed will typically disclose the compared stores sales growth: 5%

Established stores generated: 100 X 1.05 = 105M USD

The new stores generated: TOTAL - Established = 15M USD
This is the easiest way, although John used another more bottom-up approach. (as he says, it’s not complicated, it’s just very tedious)
Remember when we talked about going beyond ROIC?

John wants to calculate the Return On Incremental Invested Capital for the new stores and compare it to the old ones. ROIIC is increasing, but the market is not pricing it as such…
In this chapter, we looked at the financial drivers for a single store. Let’s take a look at some of the drivers for a Saas business.
Software
For SAAS, the unit is often the customer or subscription. You get into jargon like LifeTime Value (LTV), Customer Acquisition Cost (CAC), and churn.
Here are some definitions:
LTV: Average revenue from subscription to cancellation
CAC: Total spend on sales & marketing to acquire a customer
Churn: Number of unsubscriptions in a certain timeframe
This makes sense. What is the incremental cost you need to acquire a new customer compared to the lifetime value you will receive from that customer?
As a general rule, SAAS business should make sure their LTV = 3X CAC
Let’s take a look at some examples of specific KPIs we can find in Finchat for SAAS companies:
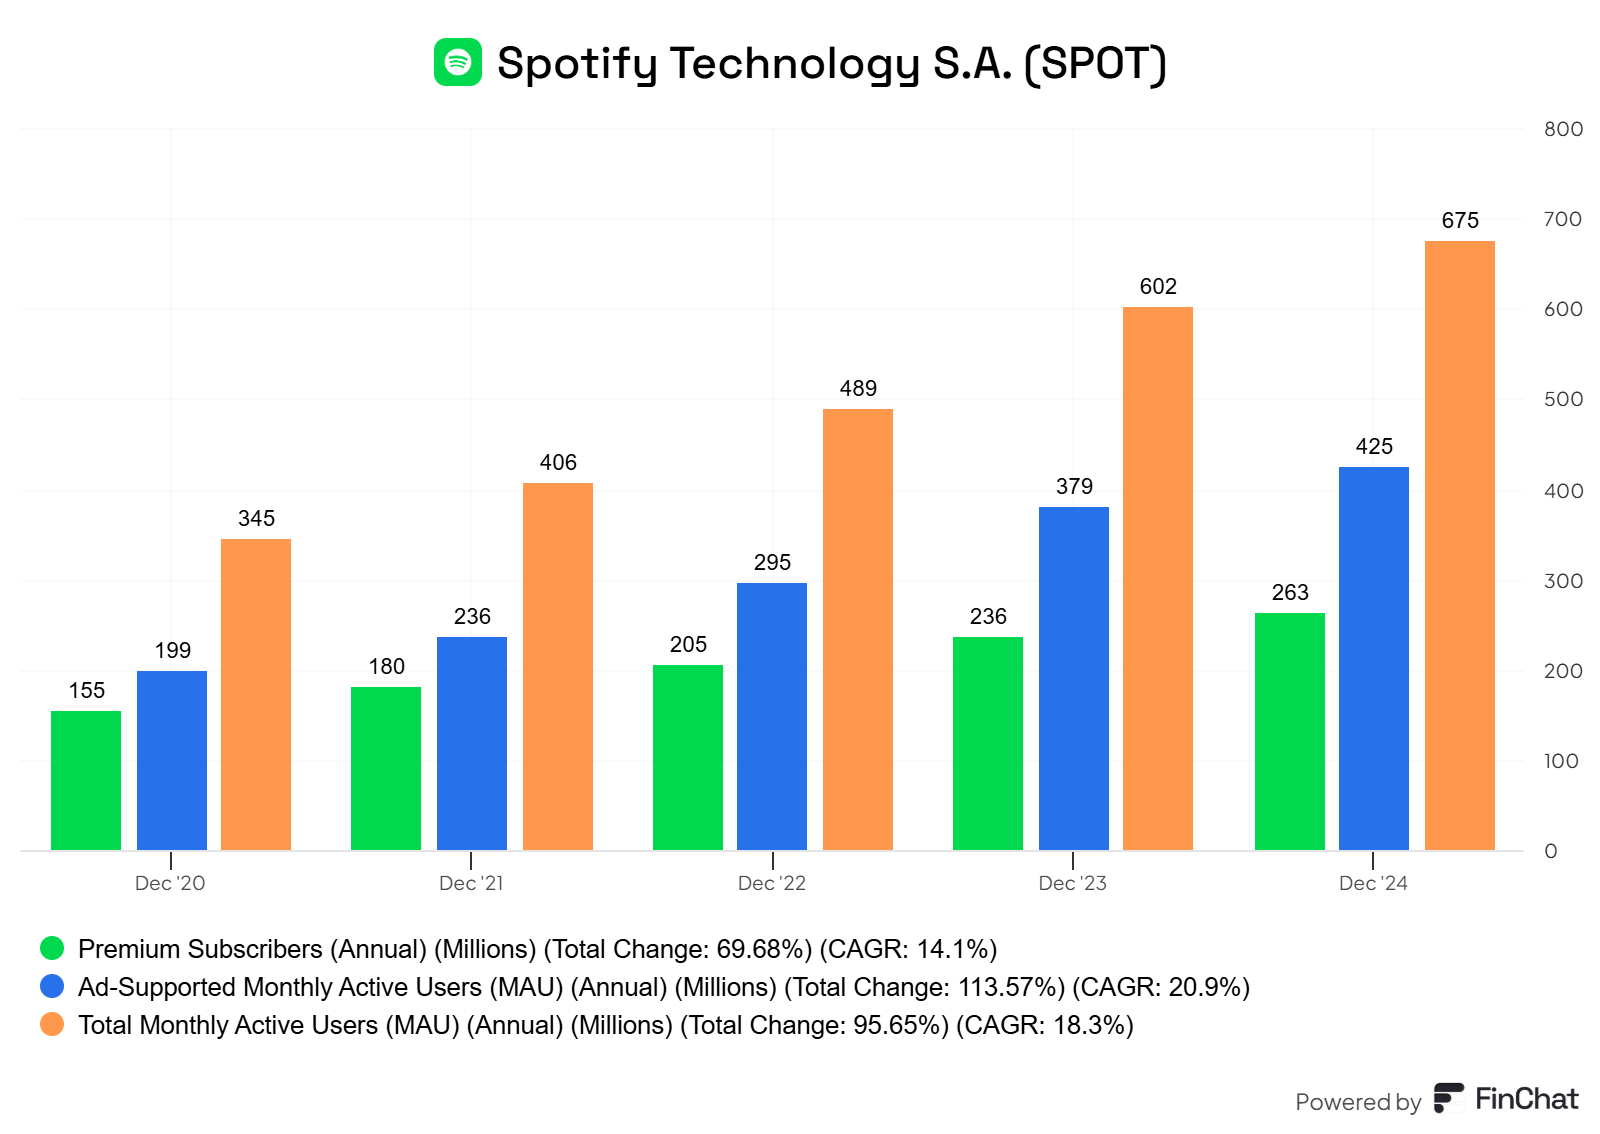
Spotify (Ticker: SPOT)
Specific KPIs:
Premium subscribers
Add supported monthly active users
Total monthly active users
All are increasing which explains the growth of Spotify.
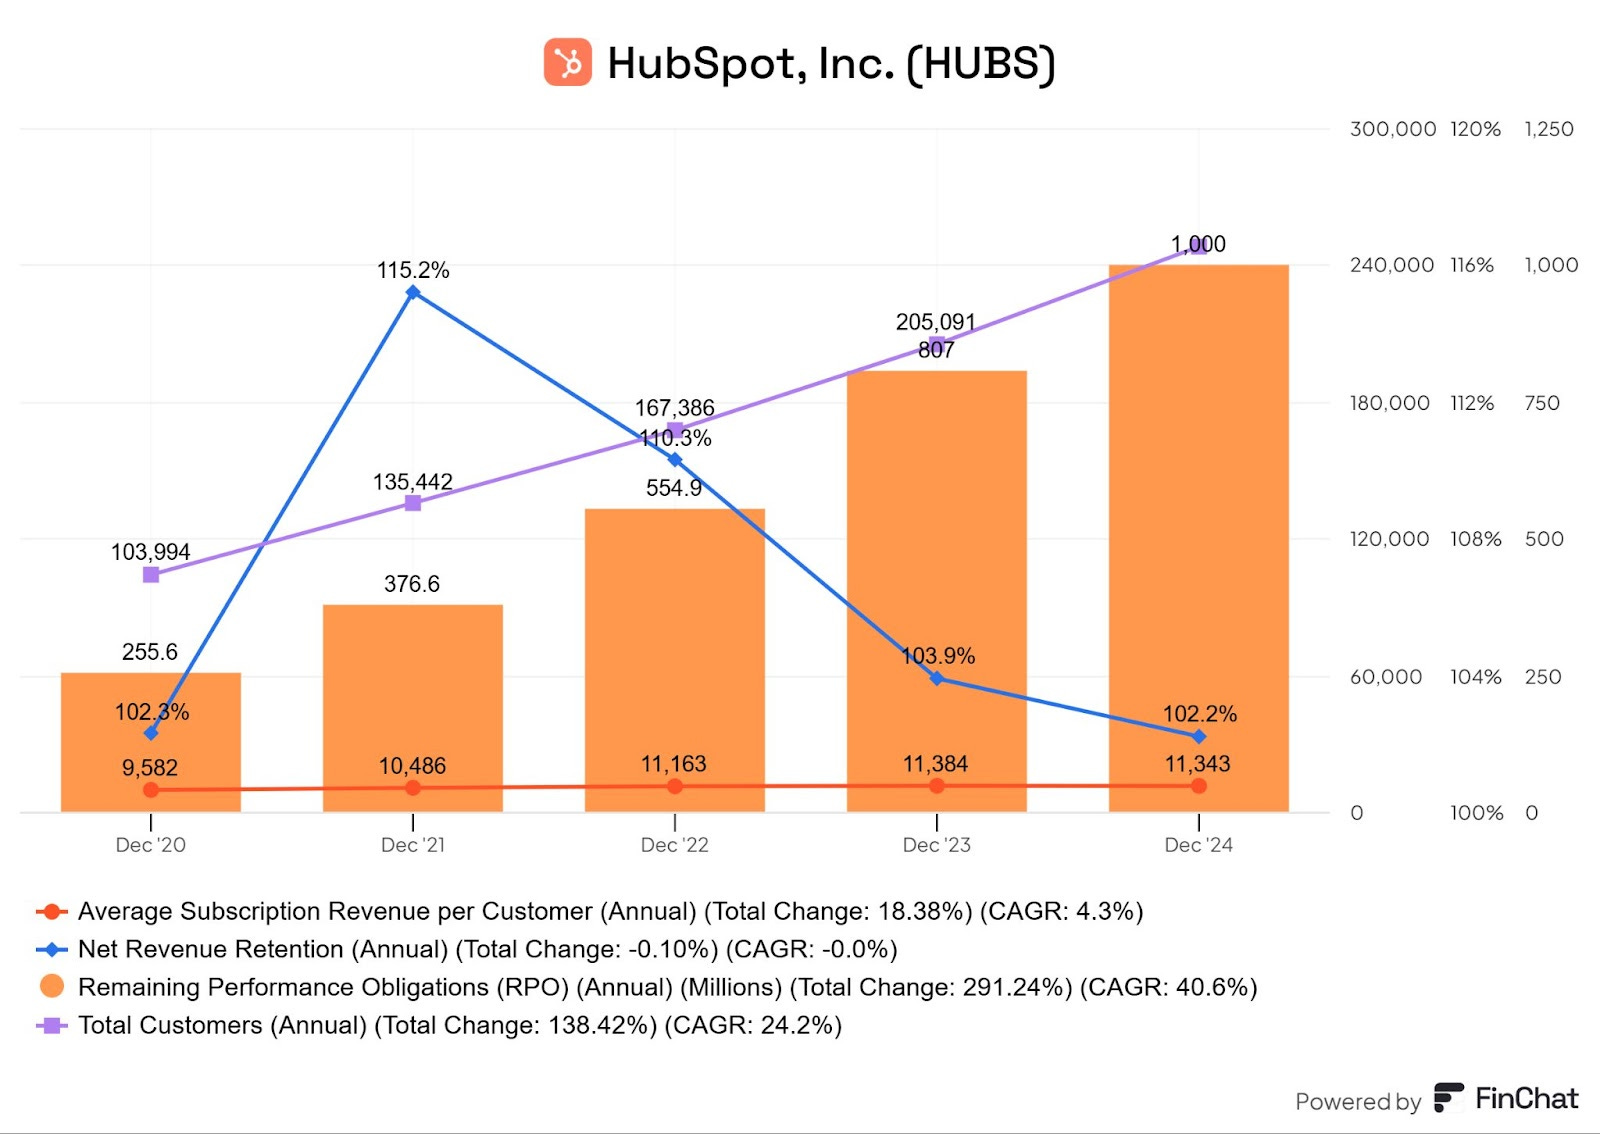
Hubspot (Ticker HUBS)
Average subscription revenue per customer: Stable for the last 3 years
Net revenue retention: Back to 102% Hubspot has a high retention rate.
Remaining performance obligations (RPO) -> revenue contracted but not yet delivered nor recognized in the income statement -> 40% CAGR at HubSpot compared to 30% CAGR for their actual revenue growth
Total number of customers: Keeps increasing at a 30% CAGR
Summary
Unit economics matter. Each business model has its specific KPIs and financial drivers. The goal is to go beyond the income statement and balance sheet, and deeply understand the underlying drivers of the company.
Finchat.io provides a shortcut with certain KPIs already embedded in their data. Now I reckon they don’t do this for the smallest companies, so for those, we’ll still have to go fetch them from the annual reports.
It’s difficult to gain an edge in investing. One way is to understand the company better than anyone else.
May the markets be with you, always!
Kevin
https://multipleexpansion.com/2020/01/30/unit-economics/
Educational as usual, Kevin! Thank you. Google's NotebookLM might help with the KPIs for the small companies. You can upload 50 files and ask it extract it for you. It is free.