


The alchemy of multibaggers - Which factors can help us find them?
From theory to making money

A call for help
My wife sometimes says I’m crazy.
She’s right.
Here’s my latest plan:
As you probably know by now, I love 100-baggers and multi-baggers. The quest to find and hold these companies keeps me motivated in the markets. It’s what makes the game we play exciting.
Several books and scientific papers have been written on ‘multibaggers’ in search of the factors that would allow us to identify them and ideally predict them.
After delving through the existing literature, I want to make a humble contribution to the space myself.
As a worldwide investor, I’m interested in knowing if the traits that make a multibagger are similar across countries and industries (most of the current publications focus on US stocks, except the global outperformers written by Dede Eyesan). The goal is to go further and see what makes these companies tick.
This also means taking into account survivorship bias (for each 10-bagger or 100-bagger, how many have been left behind? Did they not have similar traits? What is the probability of hunting down a 100-bagger? How can we improve on that probability?).
Going through all the literature, parsing through vast amounts of data, and speaking to researchers and investors, this is not a small project, but my goal is to keep you informed on its progress through regular updates.
I do need some assistance, though, to make sure I get off to a good start.
If you’re a data scientist or have experience with handling large data sets and drawing conclusions, please reach out to me. I want to approach this methodically and avoid any mistakes from the get-go.
The end goal is not theoretical. I have been working for some time on quantitative models. These are actual investing strategies that can generate above-market returns. I aim to refine these as we go deeper into this rabbit hole.
Thank you in advance, and now on to today’s article!
In February, a research paper was published on the topic of multibaggers that I think has gone unnoticed by a lot of investors. It was written by Anna Yartseva and is called
“The Alchemy of Multibagger stocks: An empirical investigation of factors that drive outperformance in the stock market.”
It was published at the Birmingham City University (United Kingdom)
You can read the full paper here.
Let’s go through it and see what we can learn. (I must mention that I left out all the technical analysis, so please read the full report if that is of interest to you!)
The questions asked
In academics, not a lot of research has been performed on multibagger stocks. You all probably know the books by Thomas Phelps and Christopher Mayer, but they focus on case studies and the qualitative properties of the winners they have analyzed. Few studies offer empirical validation of the true success drivers of these companies.
What are the key drivers for the abnormal investing returns that multibaggers generate?
And can these be empirically validated?
That’s the main goal of this research report.
The method used
The dataset used comprises pricing and fundamental data from 2000 to 2024 in the US. Based on this data, 464 companies were identified as multibaggers: companies that have increased at least 10-fold over the last 15 years (from 2009 to 2024). That’s a 16.6% annual return at the minimum. The research objectives are as follows:
Examine the fundamental and technical traits of these companies
Does the traditional Fama-French five-factor model explain or predict these companies?
Develop an enhanced model that might reveal factors offering better prediction capabilities
Analyze the impact of market conditions, like a change in interest rates, to provide additional insights
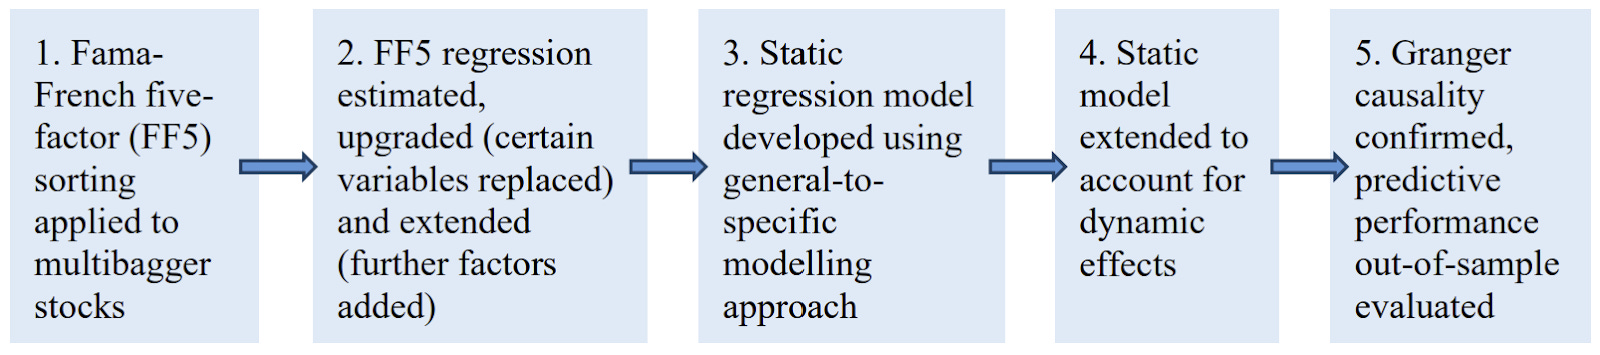
Using the classic Fama-French 5-factor model, the idea is to supplement it with factors specific to multibagger companies.
Some data on the 464 multibaggers in the scope:
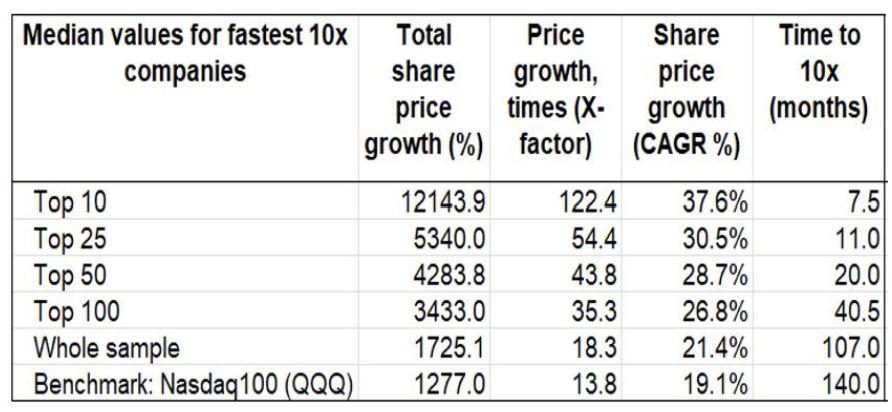
Notice that the benchmark for this period has done very well (19% CAGR).
When looking at industries/sectors, here is the distribution:
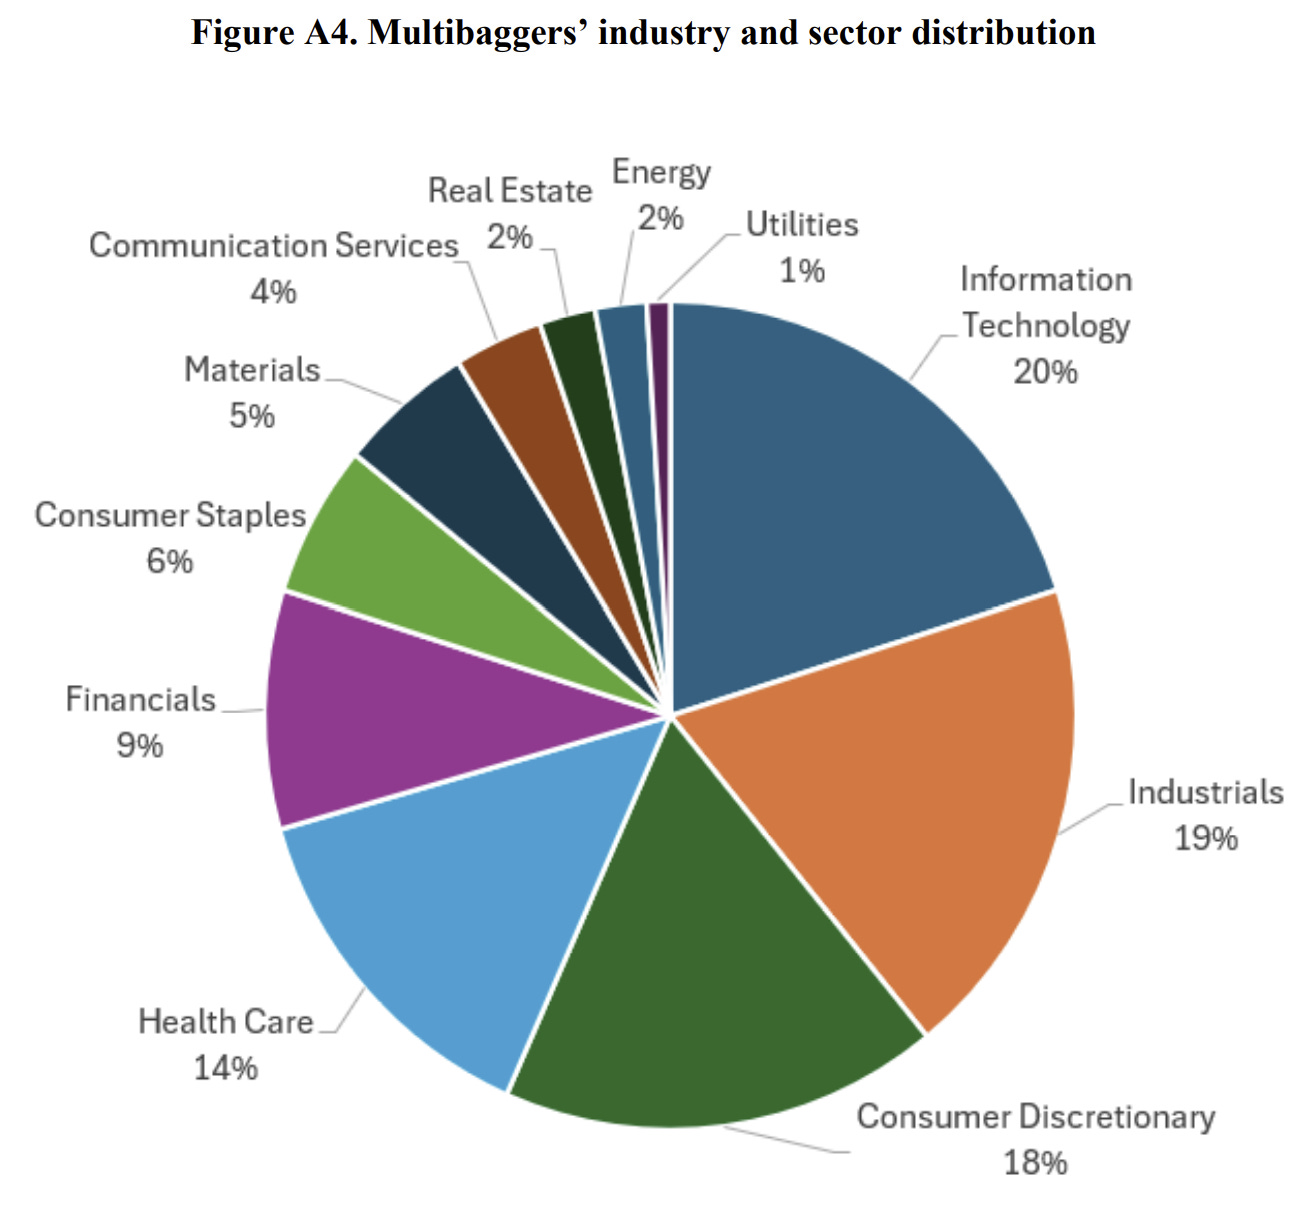
The top 5 sectors for multibaggers were:
IT
Industrials
Consumer Discretionary
Health Care
Financials
1. Preliminary conclusion of past studies
Past literature has already given a glimpse into what makes a multibagger. After all, we made a 100-bagger checklist out of it. 😁

Here’s a summary of the main drivers
Companies should be small
You can intuitively guess this. More companies grow from 50 million to 500 million than there are companies that grow from 50 billion to 500 billion.
Let’s take a look at the public companies in the world by market cap (data from unclestock.com; there are more stocks worldwide, but the % numbers are correct)
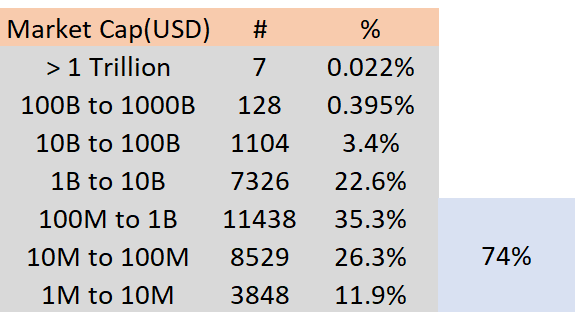
The number rapidly goes downhill once you go above 10B USD. Imagine you’re hunting for 10-baggers, it makes sense to hunt for companies around 500 million that could become 5 million companies.
Only truly exceptional companies like the MAG7 can keep growing at double digits despite their massive size. But these are anomalies.
We hunt for small companies that can double several times, so if we take everything below 1 billion, that covers 74% of the global market. So we need factors to reduce the size of that universe!
While not the focus of this article, of those 11438 companies, only half of them have positive free cash flow. You can imagine reducing the lists of companies quickly while adding more filters to the mix.
Companies should be relatively unkown
This is to benefit from multiple expansions in addition to earnings growth. Chris Mayer calls this the twin engine. If the stocks are unknown, there is more opportunity for mispricing.
You all know the Monster that is Monster beverages
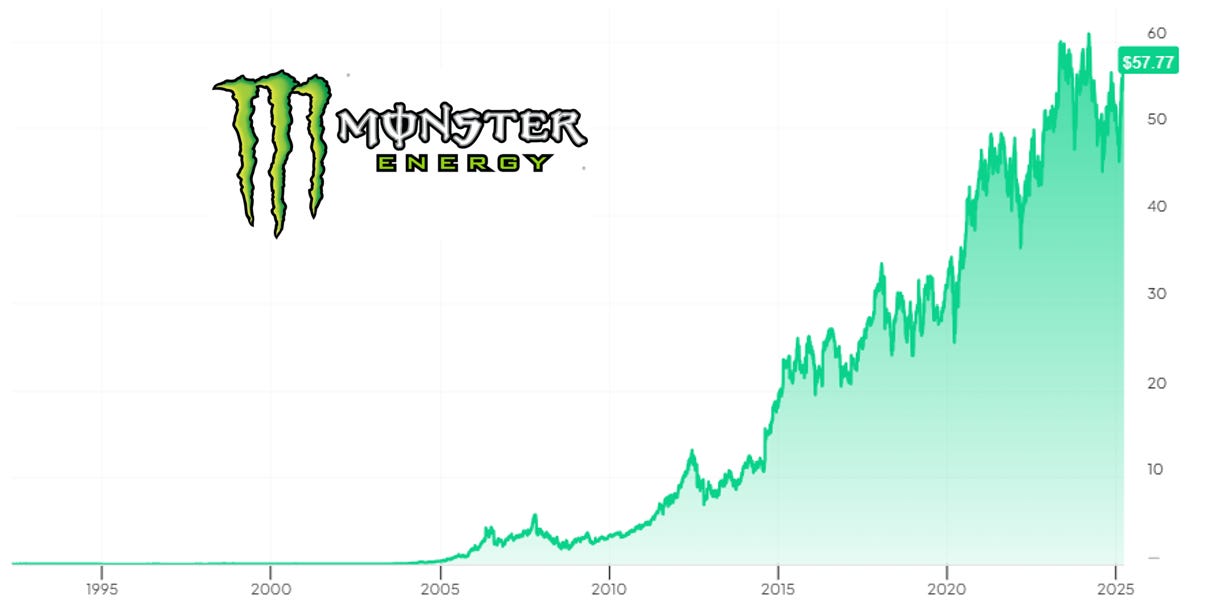
Monster was not followed up until 2005
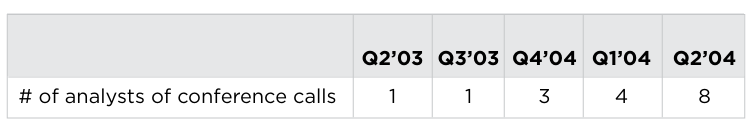
But their financial numbers were great:
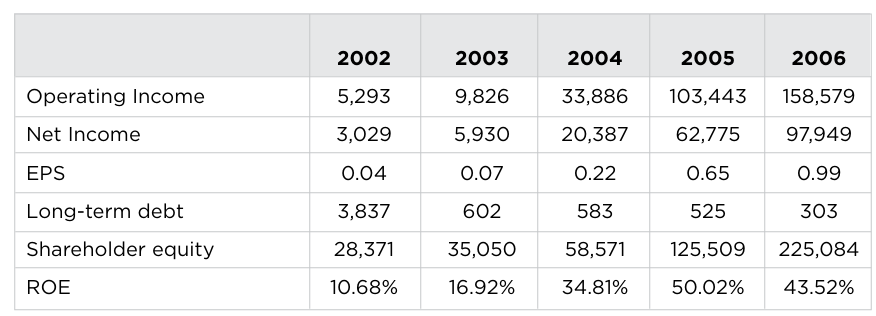
But it never looked cheap
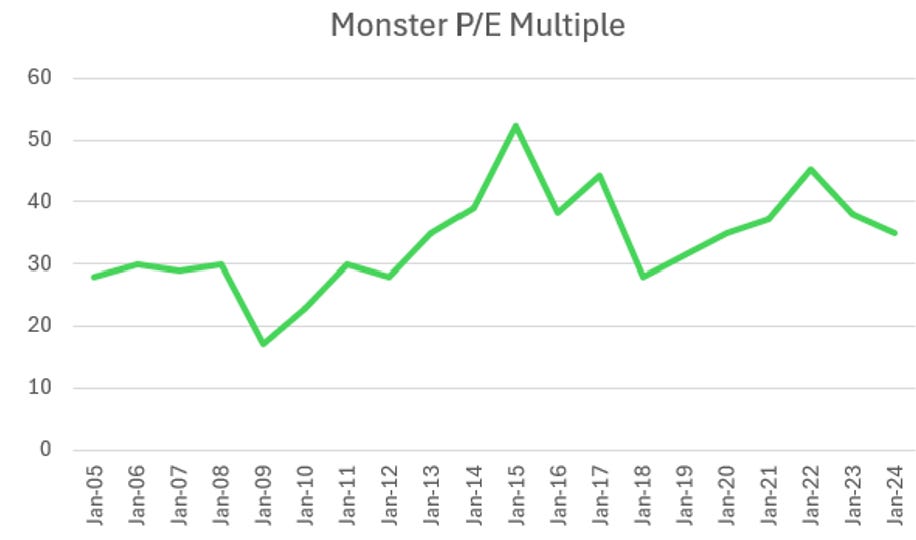
I know, I’ve said it many times before, watch out with that damn P/E multiple!

Low liquidity
Low liquidity leads to even more mispricing opportunities.
This makes sense. Low liquidity reduces competition (funds cannot come here).
Our deep dive in February is a prime example of this: Small, unknown, and low liquidity.

And what happens when a company grows and institutions can enter? Kaboom.
This is the discovery cycle, as explained by Paul Andreola. ⬇️

High quality of the business (and leadership)
A multibagger needs time to develop. It needs to not only survive but thrive. The higher the quality, the more time the business has. Quality can be quickly summed up as:
A MOAT
Low competition
Industry tailwinds
Asset-light business model with high ROE or ROIC
Alignment of incentives between shareholders and management
Growth, growth, growth
First in sales, then in earnings. Ideally, with margin expansion, you’ve found yourself a winner.
Duration of that growth
We wrote about this extensively in the past. As a quick example, a company like Monster always looked expensive. But analysts consistently underestimated how long the company could keep growing at double digits. Longevity of growth is important but hard to predict. This is why Buffett looks for inevitables, things that don’t change. A Snickers bar. Coca cola. What will still be the same 20 years from now?
Valuation
A great business is not necessarily a great investment. The entry price matters. The literature mentions looking for low PE or PEG ratios, but you know from previous articles that there are better ratios to use.
2. What can Fama-French teach us?
Here are the conclusions when applying the Fama-French five-factor model to the multibagger dataset.
In their seminal paper, they proposed the following factors that help explain returns on stocks:
Market risk: Market return vs the risk-free return
The size factor comparing small caps to larger caps
The value factor: Measured as book value to market cap
The profitability factor: How robust is the profitability of the company?
The investment factor: How much does the company invest for the future?
The entire dataset was divided according to these factors, which resulted in 36 groups of portfolios.
The results were as follows:
Size factor
As expected, small caps outperform mid caps, which outperform large caps.
In a table, it looks like this:
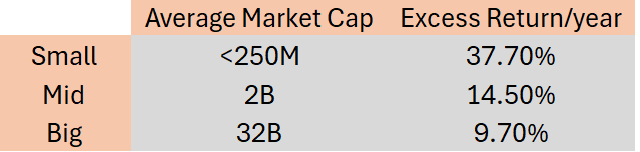
However, these are averages, and averages are heavily influenced by outliers. When looking at the median values, the results were less conclusive.
Conclusion: Small caps on their own are not enough. Other factors are needed in combination with size.
Note: 37.7% excess annual returns, you’re joking right? My quantitative modeling confirms this. When you go small and less liquid, returns increase.
Value factor
The book-to-market value was used. The smaller this ratio, the more investors are paying for the company. Of course, the book value in an intangible world poses a problem, but let’s see what it uncovers.
A similar pattern can be observed as with the size factor. But this time, when swapping out the average for the mean, the pattern stays the same. In other words, the value factor is stronger than the size factor. Buying companies “cheap” matters a lot for outsized returns.
Profitability factor
Operating profitability shows a similar trend. Avoid companies with low operating profitability.
The above discussion on size, value, and profitability also reveals that a small cap, with a high value factor and low profitability, leads to negative returns. What’s important is that the loss is less when you go bigger. This makes intuitive sense. A company that is larger most likely has more business lines and may be more geographically diversified and, therefore, more resilient.
Investment factor
All loss-making portfolios have a conservative investment approach.
You need aggressive investment as long as profitability can fuel these investments.
Final result
Although the Fama French model has helped explain where Multibagger outperformance comes from, the statistical analysis shows that there are still hidden factors that exist to fully explain the outperformance.
Let's move on to the improved model fit.
3. Enhanced modeling
To push the research even further, Anna used another technique to discover which criteria explain the returns (I’m not going to go into detail, as it gets too technical)
Applying the lesson from Phelps, Mayer, and others, multiple parameters were chosen to see which contributed the most to the final stock returns.
They analyzed more than 150 variables in the following groups:
Capital Allocation
Technical factors
Earnings growth
Financial health
Profitability
Valuation
Quality
Others
Data from 2000 to 2022 was used to create the model (sample). The data from 2023 and 2024 was used to test it (out of sample).
Here’s the result of the modeling:
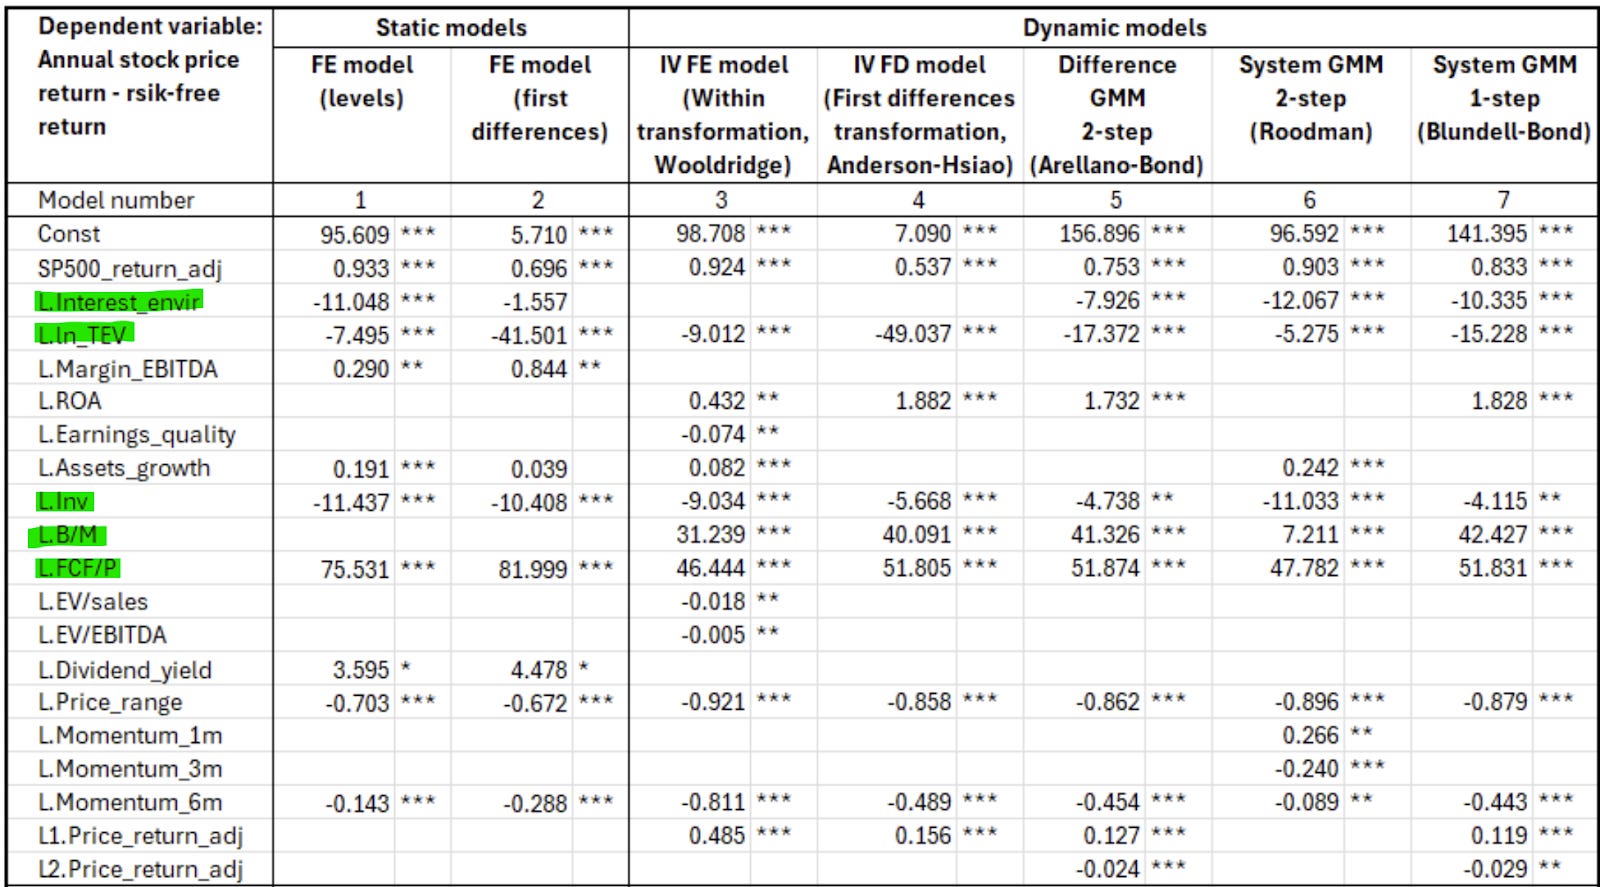
The size of the constants for each factor shows its significance. The sign of the factor shows how it affects stock returns.
An example:
FCF/P has the highest contribution. The sign is positive. So when FCF/P increases, returns increase
Interest rates have a negative sign. High interest rates lead to lower returns
Here are some of the more surprising results
Previous factors like size and profitability value were confirmed.
However, growth as in earnings growth, fcf growth were insignificant according to the model.
The aggressive investment requirement (but in line with profitability growth) was confirmed in this model. Multibaggers need continuous investments to grow.
The financial health of the company was found to be insignificant
The capital allocation decisions were found to be insignificant
The strongest factor by far is the valuation factor. In addition to the previous B/M ratio, the P/FCF ratio was used, which shows an even higher correlation.
Conclusions
FCF yield is the biggest factor to predict outperformance
Small cap, low value, and highly profitably outperform
Aggressive investment is needed as long as it does not outpace profitability growth
Entry price matters (52-week lows)
Higher interest rates depress future returns (but that is outside our control)
How can you use this information to improve your investing strategy?
As we mentioned in the 100-bagger checklist, you can use these factors in a screener.
In your stock selection process, assign more value to certain criteria like FCF yield
Devise a quant investing strategy based on research-based factor analysis (what I’m doing right now)
Finding a company with high profitability, investing for the future, and great growth at a high FCF yield is difficult. If you go small, you might find more opportunities. But when a company starts performing, the market is pretty fast at recognizing it. I love hunting for companies that were left for dead by the market. Remember that Monster, previously Hansen Natural, was also left for dead at a certain point in time.
Therefore, you could invert your screen and look for something horrible. You might find a diamond in the rubble! Or turn lead into gold.
I have several questions after reading this research, so if I can find answers, I will send you an update.
May the markets be with you, always!
Kevin
P.S. Next week, I’ll publish a company write-up. I have several in draft format, so stay tuned.
If you’re not a paid member and would like access to our deep dives, please review our offering below ⬇️
Kevin, this is how you actually do research: less guru-speak, more granular data. Bravo.
Two things jumped out at me:
1 - The FCF yield dominance confirms what we old wolves have known since before Buffett grew the gut. You buy free cash flow rather than dreams.
2 - The finding that capital allocation and financial health were insignificant in the multibagger model? Counterintuitive. But maybe not! When you're small, cheap, and profitable, the runway does the heavy lifting.
Appreciate the article. Good stuff